Organ Biofeedback Graph Software
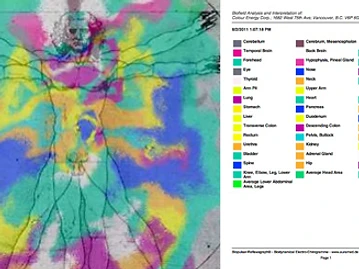
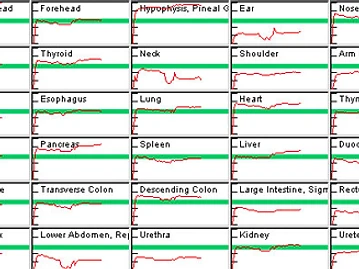
Enables you to make a quick and uncomplicated assessment of the full body. Deviations above or below the harmony line indicate organ vitality excesses or deficiencies. The graph screen presentation displays all reflex zones next to each other for a complete overview of the energetic status of all 44 organs & glands measured. Save, record, replay and print features allow you to monitor and analyze the effects of any treatment.
- Full body scanning
- Easy to understand graph display
- Displays organs
- Record, replay, save & print